Hotter and thicker Milky Way outskirts
NAOC researchers Qiao Wang, Yougang Wang, Chao Liu, Shude Mao and Richard Long investigated the outskirts of the Milky Way by using action-based methods together with the anti-center K-giant data release from the LAMOST telescope.They found that the Milky Way's outskirts are apparently larger and thicker than astronomers had previously thought. This new insight provides additional data concerning the formation of the Milky Way disc, and challenges conventional dynamical models.
The Milky Way is a typical spiral galaxy and, as such, can help us to understand the formation and evolution of other spiral galaxies. For a long time, the motions of the Milky Way's stars have been used to study the structure of the Milky Way. Astronomers have developed a number of different methods concerned with modelling the velocity distribution at different spatial positions. One of these, torus modelling, is a comparatively new method which has advantages when dealing with certain evolution problems concerning major galactic components such as disc structures.
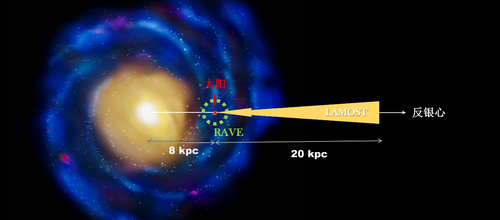
Professor James Binney at Oxford University and his colleges developed the torus method and used it with data from earlier Milky Wave surveys (RAVE and GCS).Their work explained the motions of stars in the immediate solar neighborhood, within 6,000 light years (1 kpc is 3,262 light years). More recently, the LAMOST telescope survey accumulated a large volume of data in the anti-center direction of the Milky Way out to 60,000 light years. To date, the LAMOST sample is the most important and largest sample ever.
Using LAMOST data, the NAOC researchers successfully revealed a significant feature in the dynamics of the outskirts of the Milky Way disc. The disc was found to have a kinematically hotter and thicker structure than was previously thought. This structure implies that the formation of the MW may be more complicated than was understood.
The NAOC work has been accepted for publishing in MNRAS (https://arxiv.org/pdf/1705.00425.pdf).

Fig. 1: LAMOST anti-center survey

Fig 2. The varying line-of-sight velocity distribution. The red points denote from the LAMOST data, the blue dotted curves are the conventional predictions, and the black solid curves are the predictions from this work.