Galactic rotation curve (RC) is the most powerful and direct tool to study the mass distribution of our Galaxy, including its total mass, as well as the local dark matter density. The former is a fundamental parameter of our Galaxy and is vital in understanding the formation and evolution of the Milky Way. The latter is crucial for the interpretation of any signals that DM search experiments, direct or indirect, are expected to detect.
Generally speaking, for the inner region (i.e. inside the solar circle) of the Galactic disc, the RC can be accurately measured simply using the so-called tangent-point (TP) method with the H I 21 cm or the CO 2.6 mm gas emissions in the Galactic plane as tracer. For the outer disc beyond the solar circle, the RC is derived using a variety of tracers belonging to the cold disc populations from the measured line-of-sight velocities (Vlos) and estimated distances. However, owing to the poorly estimated distances of those disk tracers and the perturbations caused by non-axisymmetric structures (e.g. central bar, spiral arm), the uncertainties of the derived RC by those disk tracers are relative large (generally of the order of tens km/s). For regions beyond the Galactic disc, the RC can be derived by the Jeans equation, i.e. measuring the radial velocity dispersion, number density andvelocityanisotropyparameter of selected halo tracers. However, due to the lack of measurements of anisotropy parameter, the previous analysis either assumes a constant anisotropy parameter or takes its value from numerical simulations, and thus could be liable to potential systematic uncertainties.
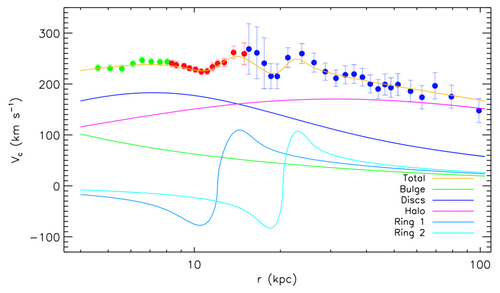
To overcome the above problems in deriving RC of outer disk and halo regions, Dr. Yang Huang and Prof. Xiaowei Liu et al. construct accurate RC of our Galaxy between 8 to 100 kpc, using ∼16000 primary red clump giants (PRCGs) selected from the LSS-GAC and the SDSS/APOGEE survey (for the outer disk region), as well as ∼5700 halo K giants (HKGs) selected from the SDSS/SEGUE survey (for the halo region). The PRCGs are standard candles and thus their distances can be measured with high accuracies (5-10%). On the other hand, PRCGs are of intermediate- to old-age stellar populations. Thus, they have enough time to dynamically mix in the disk and are therefore less affected by non-axisymmetric structures. Accordingly, Dr. Yang Huang and Prof. Xiaowei Liu et al. provide the most accurate RC of outer disk region with typical uncertainties of 5-7 km/s (see red dots in Fig. 1). For HKGs, Dr. Yang Huang and Prof. Xiaowei Liu et al. collect all the current available measurements of the velocity anisotropy parameter to derive accurate, unbiased RC of the halo region.
As Fig.1 shows, the newly constructed RC has a generally flat value of 240 km/s within a Galactocentric distance r of 25 kpc and then decreases steadily to 150 km/s at r ∼ 100 kpc. On top of this overall trend, the RC exhibits two prominent localized dips, one at r ∼ 11 kpc and another at r ∼ 19 kpc. From the newly constructed RC, combined with other constraints, we have built a parametrized mass model for the Galaxy, yielding a virial mass of the Milky Way’s dark matter halo of (0.9±0.08)×1012Mand a local dark matter density 0.32±0.02 GeV cm-3.
This paper has been published in monthly notices of the royal astronomical society (MNRAS).

Figure 1: Final combined RC of the Milky Way to∼100kpc derived from HIdata (green dots, from Fich et al.), PRCGs (red dots) and HKGs (bluedots). Lines of different colors as labelled in the bottom-right corner of the diagram represent the best-fitting RCs contributions to the components of the Milky Way, with the line in gold representing the sum of contributions from all the mass components.


