The chemical composition is an important feature of a star, which carries information about its birthplace environment, evolutional process, and so on. Large spectroscopic surveys in the Milky Way help us to obtain the chemical compositions of huge amount of stars, and further to understand our Galaxy’s structure and history.
The Large Sky Area Multi-Object Fiber Spectroscopic Telescope (LAMOST) survey provides a very large catalog of spectra. Based on the LAMOST DR4 data, researchers at Columbia University and other institutions have recently provided the abundance estimates of elements formed in a variety of environments and processes for 3.7 million stars. Their results has been published in The Astrophysical Journal.
Using a small group of stars observed by both LAMOST and GALAH (GALactic Archaeology with HERMES) survey, the researchers calibrated a model that mapped abundances and other parameters of the stellar atmosphere, like temperature and the strength of the gravitational field, to spectra. Then the model was applied to the LAMOST spectra to obtain the parameters and chemical abundances for each star observed, which can be accessed online.
“This data is especially valuable,” said Adam Wheeler, the first author of the research paper. “LAMOST has extensive coverage of the Milky Way’s disk, halo, and, in particular, the outer disk, where the detailed chemodynamics are largely unexplored.”
By examining stars that appear to be born at the same place and time, the researchers verified that the abundances can help to find stars which were born together, an important step in unraveling the history of the Milky Way.
Moreover, nearly every star observed by LAMOST is also observed by Gaia, the European Space Agency’s space-based observatory, which provides precise 3D positions and velocities. “This allowed us to make ‘chemical maps’ of the Milky Way, which provide an unprecedented perspective on chemistry across the Galaxy,” said Adam Features of the maps, such as the “flaring” seen in several elements, can help researchers to understand the properties of the populations of stars that make of the Galaxy.
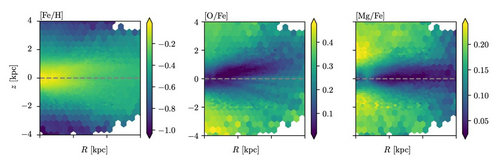
Figure: Examples of the “chemical maps” of the Milky Way. (Credit: Adam Wheeler)
Each panel shows the Galaxy in profile, painted by the abundance of the denoted element. The x-axis, R, corresponds to the radius from the center of the Milky Way, and the y-axis corresponds to the distance from the midplane of the Galaxy, in which the sun resides (the sun is located at roughly R = 8 kiloparsecs, z = 0 kiloparsecs). The “[A/B]” notation refers to the log-ration of the two elements, scaled to the value of the sun. So a star with [Mg/Fe] = 0 has the same ratio of magnesium to iron as the sun, but one with [Mg/Fe] = 1, has a ratio ten times greater.
The paper can be accessed at https://iopscience.iop.org/article/10.3847/1538-4357/ab9a46
Address: 20A Datun Road, Chaoyang District, Beijing, China code: 100012
Tel: 010-64888708 E-mail: naoc@nao.cas.cn